



Your company has deployed copilots, customer-facing AI, and internal automation. Usage dashboards look healthy, and teams say they save time. Then the board asks a harder question: What did AI actually change in the business?
PwC’s 2026 Global CEO Survey, covering 4,454 CEOs across 95 countries and territories, shows why this question matters. Only 12% reported both revenue and cost benefits from AI. Meanwhile, 56% saw no significant financial benefit.
The missing piece is often not another tool. It is an AI impact measurement framework connecting performance and AI adoption to operational and financial outcomes. This guide explains how to build that connection from pilot through production.
Table of Contents
Key Takeaways
- AI adoption is an early signal, not proof of value. A credible assessment requires a stable pre-AI baseline.
- Technical quality, adoption, operations, and financial value need separate metrics.
- Average productivity gains can conceal major differences between user groups.
- ROI must include implementation and ongoing operating costs.
- Better results after launch do not automatically prove that AI caused them.
What Is AI Impact Measurement, and Why Do Enterprises Need It?
It is a structured system for defining, tracking, and attributing the technical, behavioral, operational, business, and financial effects of an AI initiative.
It answers five connected questions:
- Does the AI work?
- Do people use it effectively?
- Does it change the workflow?
- Does the changed workflow improve a business outcome?
- Is that value greater than the total investment?
Measurement is therefore an enterprise management issue, not simply an analytics task. Engineering can report accuracy and latency. Product teams can track usage. Yet neither view proves business impact or value realization without operational and financial evidence.
This gap is common. IBM Institute for Business Value found that 72% of Chief AI Officers believe their organizations risk falling behind without AI impact measurement. Still, 68% initiate projects even when they cannot assess their effect.
Companies often know what AI costs and how frequently people use it. Those numbers do not automatically reveal whether it produces value. An AI maturity assessment can clarify whether the data, ownership, and processes needed for reliable measurement already exist.
The AI Impact Measurement Framework: From Baseline to Financial Value
The framework works as a chain, not six disconnected metric categories. A weakness near the top prevents value farther down. Poor accuracy reduces trust, while low trust slows use. Usage without workflow integration does not change operational KPIs. An operational improvement that is financially immaterial produces little meaningful return.
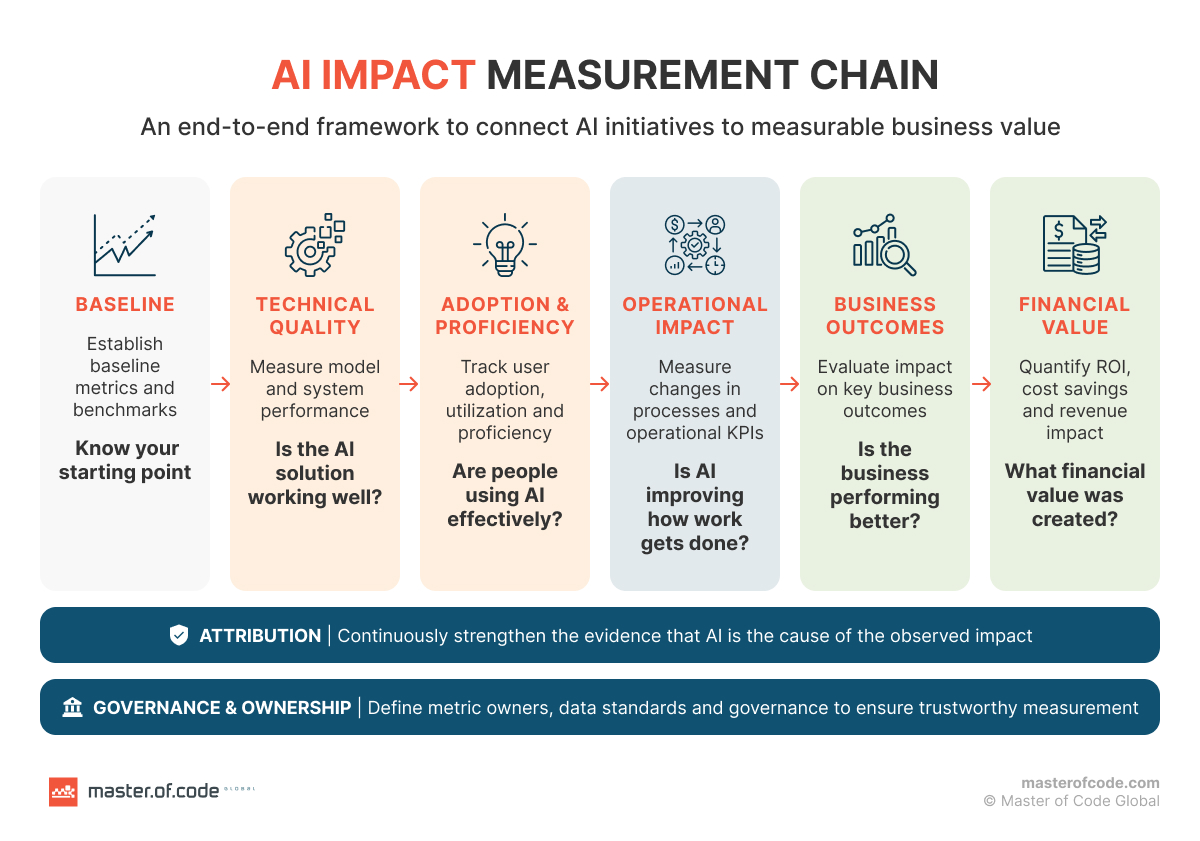
Governance, attribution, and ownership apply across every stage.
Step 0: Set Baseline Metrics Before Implementing AI
You cannot credibly measure improvement without knowing what performance looked like before AI. Start with a business hypothesis tied to the exact workflow being changed.
“Implement an AI customer service assistant” is not a measurable hypothesis. “Reduce average handling time by 20% while maintaining CSAT and first-contact resolution” is. Another useful hypothesis might be to increase qualified lead capacity without adding sales headcount.
Next, record baseline metrics such as response time, cost per case, cycle time, conversion, rework, employee hours, CSAT, and escalation rate. Define the measurement period and KPIs before development. Avoid comparing an unusually weak week with a strong seasonal period.
Where possible, establish benchmarks by role, team, location, customer segment, and task complexity. This segmentation prevents broad averages from hiding important differences. An AI Compass Sprint can help teams identify the right workflow, hypothesis, and baseline before committing to development. A focused AI pilot can then test them with a controlled scope.
Our real estate voice agent case shows the value of a clear starting point. Before implementation, response cycles averaged 12–14 hours, and lead-to-conversation stood at 11%. Paid acquisition costs had risen 28%, while qualified lead costs increased 18%. After launch, response time fell 78%, lead-to-showing conversion rose 35%, and the company handled 42% more leads without new hires. Qualified cost per lead dropped 45%. This chain says much more than “the AI automated calls.”
Step 1: Measure AI Quality and Technical Performance
Technical metrics show whether the system is reliable enough to create value. They cannot prove value alone.
Choose measures that reflect the use case:
- Quality: Accuracy, factual correctness, precision and recall, hallucination rate, task completion, and output acceptance.
- Reliability: Availability, failures, timeouts, consistency, and performance drift.
- Experience: Latency, response time, and successful interaction rate.
- Economics: Token consumption, inference cost, and cost per successful task.
- Safety and risk: Noncompliant outputs, privacy incidents, and escalation rate.
The NIST AI Risk Management Framework recommends quantitative, qualitative, or mixed methods. It also calls for documented testing, performance benchmarks, and continued measurement after deployment. Tests should reflect real operating conditions, not curated demonstrations.
A model can score better on an evaluation set while leaving the process unchanged. Technical quality is permission to continue measuring impact, not the final impact metric. For high-risk tasks, human-in-the-loop controls improve AI accuracy and provide useful signals such as acceptance, correction, and escalation rates. A technical audit can identify quality, reliability, security, and cost gaps before scaling.
Step 2: Measure AI Adoption, Utilization, and Proficiency
Usage needs more context than a monthly active user count. Separate adoption, utilization, and proficiency.
Adoption shows who has started using the system. Track activated users, active users, workflow penetration, and the AI adoption rate.
Utilization shows how often and where the tool appears in real work. Useful utilization metrics include sessions per user, feature usage, AI-assisted versus non-AI tasks, and the share of eligible workflows using AI.
Proficiency shows whether people use the system effectively. Signals include task completion, output acceptance, major-edit rates, avoidable escalations, advanced feature use, and confidence. User adoption can look healthy while weak AI proficiency limits outcomes.
An NBER field study of 5,179 customer support agents illustrates why segmentation matters. AI assistance increased productivity by 14% on average. Gains reached 34% among novice and lower-skilled workers, while experienced workers saw minimal effects.
Do not rely on one organization-wide AI productivity number. Compare results by experience, role, team, workflow, and proficiency. The pattern reveals where AI enablement, training, or process redesign is needed.
Step 3: Measure Operational and Business Impact
Once the system works and people use it, ask whether the process changes. Start with operational KPIs: task time, throughput, cases handled, cost per case, first-contact resolution, rework, response time, containment, and human escalation.
Then move one level higher to the desired business outcome:
- Customer support: CSAT, retention, churn, and cost to serve.
- Sales: Conversion, qualified pipeline, cycle length, win rate, and revenue.
- Operations: Capacity, downtime, forecast accuracy, waste, and SLA compliance.
- Software delivery: Release frequency, lead time, escaped defects, and stability.
“Time saved” is not automatically a financial value. It matters when the organization converts those hours into more capacity, lower costs, faster revenue, better quality, or another measurable outcome.
Balanced measurement prevents local improvements from creating wider problems. DORA’s 2025 research found that 90% of technology professionals use AI at work, and more than 80% believe it improves productivity. However, higher usage was associated with both greater delivery throughput and greater instability. Speed must therefore be paired with quality and risk measures.
We used this balanced approach when building Agent Assist for Zipify. The solution delivered 65% faster responses, twice-faster ticket closure, 30% lower operating costs, and 24% higher customer satisfaction. Its analytical dashboard also tracked conversation quality, sentiment, agent performance, and resolution speed. Together, these measures connected AI usage to workflow speed, operating costs, and customer outcomes.
Step 4: Calculate AI ROI and Total Cost of Ownership
ROI belongs near the end of the measurement chain. Do not start with “How much time did AI save?” Start with “What economic value did the changed outcome create?”
Use the standard formula:
AI ROI = (Financial benefits − Total AI costs) ÷ Total AI costs × 100
Benefits may come from released labor capacity, fewer outsourced interactions, lower rework, fewer errors, or reduced downtime. Revenue gains may include higher conversion, retention, capacity, incremental sales, and faster time to market. Our guide to how AI reduces costs explains how operational changes translate into economic value.
The cost side must include the total cost of ownership, not only API fees. Count implementation, integrations, model usage, infrastructure, data preparation, human review, training, change management, security, observability, maintenance, and optimization.
Keep projected and realized returns separate. Projected ROI is the business case estimate made before full deployment. Realized ROI is the financial value observed after implementation. PwC’s finding that only 12% of CEOs report both revenue and cost benefits shows why forecasts need post-launch validation.
Cost architecture also matters. Compare Build vs. Buy AI using the same horizon and assumptions. Review the likely AI cost and the AI MVP cost before selecting a route. For a deeper model, use our guide to AI ROI.
How to Choose AI Metrics: Leading, Lagging, Quantitative, and Qualitative
Leading indicators show whether the conditions required for value are developing. Examples include training completion, user adoption, workflow penetration, AI acceptance, proficiency, and technical quality.
Lagging indicators confirm whether the desired outcomes occurred. They include conversion, cost reduction, CSAT, retention, cycle-time improvement, margin, and revenue. A useful system needs both. Strong leading indicators with flat lagging indicators suggest people are using AI without producing downstream value.
Quantitative measures capture time, cost, volume, accuracy, conversion, and errors. Qualitative evidence includes user trust, employee confidence, customer feedback, workflow friction, manager observations, and expert review.
Qualitative evidence is not a substitute for data. It explains why quantitative results moved or stayed flat. NIST supports mixed-method evaluation, including input from domain experts and users.
The Mira proof of concept demonstrates this combination. Students produced 11.6 times more words per reflection, averaging 431 words. However, volume was not treated as the final result. The team also measured twice-deep thinking across seven metacognitive indicators. The stronger question was not whether students wrote more, but whether their reflections showed a better-quality outcome.
How Do You Know AI Actually Caused the Improvement?
A KPI can improve after launch without improving because of AI. Conversion may rise while pricing, staffing, seasonality, or the website also change. Before-and-after comparison is useful, but not always causal.
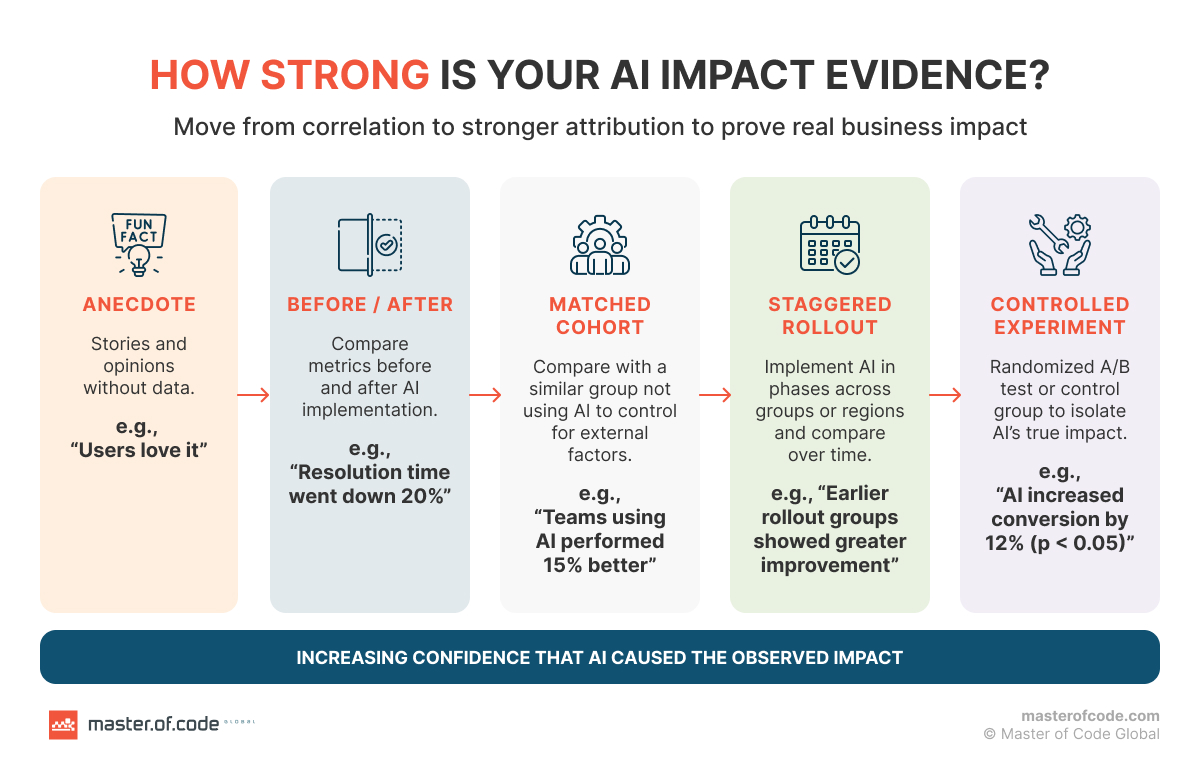
Choose an attribution method that matches the investment decision:
- A/B test: Compare the AI-enabled and control groups during the same period.
- Staggered rollout: Launch across teams or regions at different times.
- Matched cohorts: Compare similar users or workflows with and without AI.
- Historical baseline: Control for seasonality and major operational changes.
- Workflow telemetry: Tag AI-assisted tasks and connect them to final outcomes.
McKinsey recommends building attribution into rollout through A/B testing or staggered deployment. This is stronger than reconstructing impact months later.
The rule is straightforward: the more consequential the investment decision, the stronger the attribution evidence should be.
Who Owns AI Measurement and Value Realization?
Measurement fails when one team owns every metric. Responsibility should follow the stage of the impact chain.
- Engineering and data own accuracy, reliability, latency, technical safety, and model cost.
- Product or AI leads own adoption, utilization, feature engagement, and feedback loops.
- Business and process owners own workflow performance, capacity, quality, and customer results.
- Finance validates costs, savings, revenue attribution, and ROI assumptions.
- Executive sponsors and AI governance own portfolio priorities, decision gates, and accountability.
IBM reports that organizations with a CAIO see 10% greater returns on AI spend. Centralized or hub-and-spoke models are associated with 36% higher returns than decentralized ones. These are associations, not proof that adding a CAIO causes better performance. The practical lesson is that clear authority and cross-functional ownership matter.
Use a review cadence from pilot to production: pilot gate, production gate, 30-, 60-, and 90-day reviews, then quarterly value reviews. Each meeting should lead to one decision: scale, optimize, redesign, or stop. Our guide on how to implement AI in business covers the broader operating model around those decisions.
Common AI Impact Measurement Mistakes
1. Measuring After Launch Instead of Before
Without a baseline, teams cannot show credible improvement.
2. Treating Usage as Value
High AI adoption can coexist with zero measurable business value. Usage is evidence of access and interest, not an outcome.
3. Tracking Only Time Saved
Saved time matters only when it produces output, outcomes, or lower costs.
4. Measuring Only Technical Accuracy
An accurate model with poor usability or workflow integration may create no material business impact.
5. Using One Productivity Average
The NBER study shows that different user groups can experience dramatically different gains. Segment the result before deciding where to scale.
6. Ignoring Quality Trade-Offs
Faster output may increase reviews, defects, rework, or instability. DORA’s findings show why speed and quality must be assessed together.
7. Mixing Projected and Realized ROI
Forecasts guide investment. Production evidence shows whether assumptions survived real use.
8. Ignoring Full TCO
Data preparation, training, verification, infrastructure, governance, and maintenance can materially change the economics.
9. Leaving Metrics Without Owners
A KPI without an accountable owner becomes dashboard reporting instead of active management.
10. Measuring Everything
Every metric should map to a decision. If a number cannot affect a scale, optimize, redesign, or stop decision, question why it is collected. This lack of focus is one reason AI transformations fail.
How Master of Code Global Helps Measure and Improve AI Impact
We help enterprises design measurement into an initiative before development begins. Our AI consulting services connect high-value workflows with baselines, technical and business success criteria, controlled pilots, and scale decisions.
We instrument usage, evaluate model quality, connect AI telemetry with business systems, and build outcome dashboards. We also model TCO, define attribution methods, and create production gates. After launch, the same evidence guides optimization.
The cases above show how this works across different settings. The real estate voice agent connected response speed to conversion and lead costs. Zipify linked support efficiency with cost and customer satisfaction. Mira paired activity volume with the quality of student reflection.
The point of a pilot is not simply to prove that AI can perform a task. It should produce enough evidence to decide whether that capability deserves to scale. If you are planning an initiative or questioning an existing one, talk to our AI consulting team to define or validate its measurement model.
Turn AI Measurement Into a Business Decision
The hardest part of AI measurement is not collecting more telemetry. It is building a defensible chain between what the technology does and what changes in the business.
That chain runs from baseline to performance, adoption, operations, business outcomes, and economics. A practical AI impact measurement framework makes every link visible and assigns ownership to it. It should tell leaders more than whether AI is “working.” It should show whether to scale it, improve it, redesign it, or stop investing.
Start with a focused AI pilot, or discuss the next step with our AI consulting team.
Discover how Master of Code Global can help enhance your customer’s experience and boost sales growth.